Note
Click here to download the full example code
4.2. Visualizing Answer Traces of Continuous SPARQL Query Engines
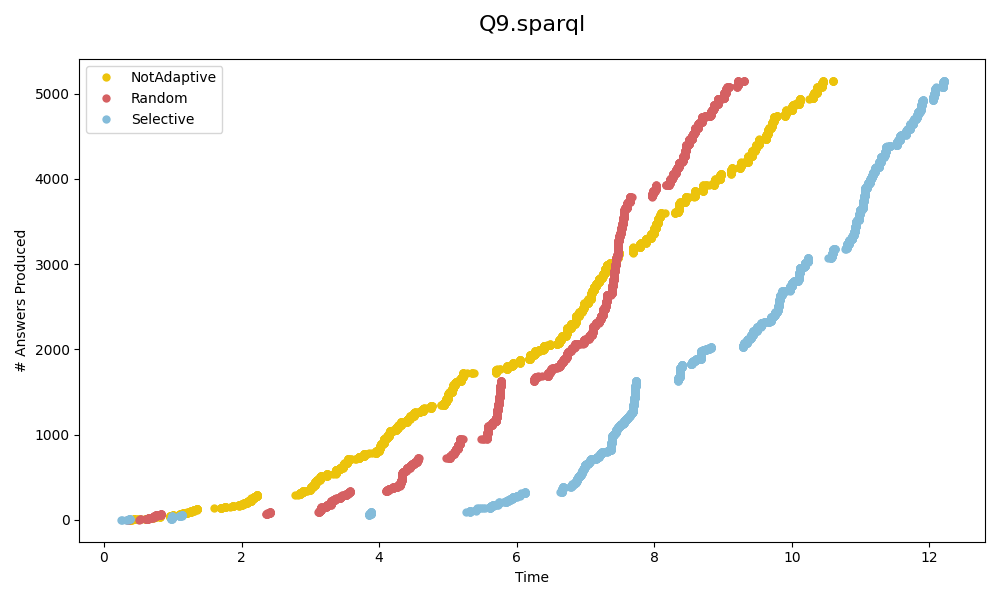
To measure the diefficiency of approaches, the metrics dief@t and dief@k compute the area under the curve (AUC) of the answer traces. Answer traces record the points in time when an approach produces an answer.
With the diefpy package, it is possible to plot the answer trace of a SPARQL query engine when executing a query
using the diefpy.plot_answer_trace method.
import diefpy

COLORS = ["#ECC30B", "#D56062", "#84BCDA"]

# Load the answer trace file with the query traces from FigShare.
traces = diefpy.load_trace("https://ndownloader.figshare.com/files/9625852")

# Plot the answer trace recorded in `traces` for query `Q9.sparql`
diefpy.plot_answer_trace(traces, "Q9.sparql", COLORS).show()

Conclusion: For Q9.sparql, we obseve that the answer trace of nLDE Not Adaptive (yellow line) surpasses
the answer traces of the other approaches. This indicates that nLDE Not Adaptive continuously produces more
answers than the other approaches.
Total running time of the script: ( 0 minutes 37.303 seconds)